
The hidden cost of slow product development after raising capital


Series A capital increases expectations around measurable acceleration. As teams expand and roadmaps widen, investors evaluate how effectively additional resources translate into revenue expansion. At this stage, product development speed after funding signals whether scaling capacity converts into sustained output.
When delivery progresses more slowly than capital deployment, structural pressure builds inside the organization. Efficiency trends level off, expansion timelines extend, and forecast precision weakens even while Annual Recurring Revenue (ARR) advances.
This article examines how scaling dynamics reshape execution capacity, how reduced velocity alters financial structure, and how gradual changes in throughput evolve into strategic and capital allocation exposure.
Why Speed Becomes the Core Expectation After Series A
Once capital is raised at the A round, the lens shifts from validation to scalability. Investors assume demand exists and the product has traction. The core assessment centers on whether the company can convert capital and roadmap into efficient revenue expansion. At this stage, product execution after Series A becomes the dominant risk variable.
The expectations crystallize around measurable acceleration:
- Roadmap → ARR conversion
Features and platform investments translate into predictable increases in recurring revenue within defined quarters. - Net Revenue Retention expansion
Account growth compounds through upsell, cross-sell, and usage expansion, pushing NRR beyond the 110% range. - Unit economics improvement
Burn multiple trends toward ~1.5× and lower as ARR scales, reflecting disciplined capital allocation. - Rising ARR per employee
Headcount expansion increases recurring revenue output per dollar of payroll and operating cost.
Capital at this stage prices in execution momentum. When product velocity compresses while spend and coordination load expand, investors interpret it as structural friction inside the scaling system. Speed becomes a proxy for organizational throughput — the capacity to absorb complexity and convert it into compounding recurring revenue.

The First Visible Signs of Slowdown
In a post-Series A B2B SaaS company, execution slowdown usually becomes visible in operational patterns before it appears in financial metrics. These early signals often mark the beginning of a post-Series A slowdown, even when revenue numbers still look stable.
Roadmap shifts more frequently
Quarterly priorities begin to move during the cycle. Features planned for one release shift into the next. Scope adjustments become more common as delivery progresses.
Projects take longer to complete than initially estimated. Planning sessions require more cross-functional alignment. Over time, the roadmap reflects delivery capacity rather than strategic sequencing. This is often the first practical sign that product velocity after funding is no longer increasing in line with headcount and investment.
Release predictability declines
Release timing becomes less consistent. Intervals between deployments increase, delivery windows widen. Instead of regular incremental updates, changes are grouped into larger releases. Forecast accuracy decreases, and release dates require more revision.
Sales relies more on future commitments
A growing share of the pipeline depends on functionality that has not yet shipped. Revenue projections include features planned for upcoming quarters.
As this pattern expands:
- Forecast variance increases
- Expansion conversations take longer
- Deal closure depends more heavily on roadmap timing
Effort increases while revenue conversion slows
Engineering activity expands, more work runs in parallel, and internal coordination requirements increase. At the same time, the time from development start to revenue impact extends. The organization shows higher activity levels, while the conversion of product work into monetizable outcomes slows.
These patterns describe observable changes in delivery behavior. The structural drivers sit beneath them.
What Actually Causes the Slowdown
In post-PMF B2B SaaS companies moving from $1–5M ARR toward Series B, execution drag typically reflects three structural transitions. These shifts are mechanical. They emerge as the organization crosses scaling thresholds in team size, system design, and operating discipline: a pattern frequently underlying a broader post-Series A slowdown.
1. Coordination Threshold
As technical teams grow from roughly 8 to 20-30 developers, communication paths expand nonlinearly. The number of potential coordination links follows the classic n(n−1)/2 dynamic:
- 8 engineers → 28 possible communication paths
- 20 engineers → 190 paths
- 30 engineers → 435 paths
Total output may rise with headcount, yet output per engineer often flattens or declines unless ownership boundaries and modularization evolve alongside growth. This coordination threshold is one of the structural reasons why product development slows after funding, even when hiring accelerates.
2. MVP Architecture Meets Scale
Early MVP systems prioritize speed over modularity. Monolithic services, shared databases, and tightly coupled components support rapid experimentation during the search phase.
As ARR expands and customer load increases, those early shortcuts become constraints. Surveys show that roughly 73% of development teams report productivity loss linked to accumulated technical debt. In scaling SaaS environments, roadmap capacity increasingly shifts toward:
- Refactoring core components
- CI/CD improvements
- Test coverage expansion
- Observability and reliability upgrades
Empirical deployment studies show that tightly coupled systems exhibit roughly 2× longer lead times and significantly lower deployment frequency compared to modular architectures. As a result, product velocity after funding can moderate while structural resilience improves.
3. Governance Expansion
As companies prepare for enterprise sales and Series B scrutiny, governance mechanisms expand. QA layers formalize. Compliance requirements such as SOC 2 are embedded. Release processes become structured and auditable.
DORA research shows that manual approval gates and layered reviews can reduce deployment frequency by 20-50% when introduced without automation. Additional management layers also increase decision latency, with studies estimating that approval cycles are 15-30% longer per added layer.
At this stage, part of the observed product development slowdown after funding reflects a deliberate shift toward stability, auditability, and operational discipline. Reliability improves, incident rates decline, and recovery becomes more predictable, while feature throughput typically stabilizes at a lower but more controlled pace.
Together, coordination expansion, architectural constraint, and governance formalization explain the structural mechanics behind execution drag during scaling. The slowdown reflects system transformation rather than reduced effort.
The Financial Damage Most Founders Underestimate
Execution slowdown after funding rarely creates an immediate collapse. It changes financial physics. Burn accelerates faster than revenue compounding, efficiency ratios flatten, and the economic impact of delay accumulates invisibly.
Three financial vectors absorb most of that damage.
1. Burn Efficiency
Burn multiple, net burn divided by net new ARR, has become a standard efficiency metric in growth-stage SaaS (popularized by Bessemer and Tomasz Tunguz).
Industry benchmarks across growth-stage SaaS commonly indicate:
- Early growth SaaS companies often operate around ~1.5×–2.5× burn multiples.
- More efficient operators trend closer to ~1.0×–1.5× as they approach Series B.
The math is mechanical.
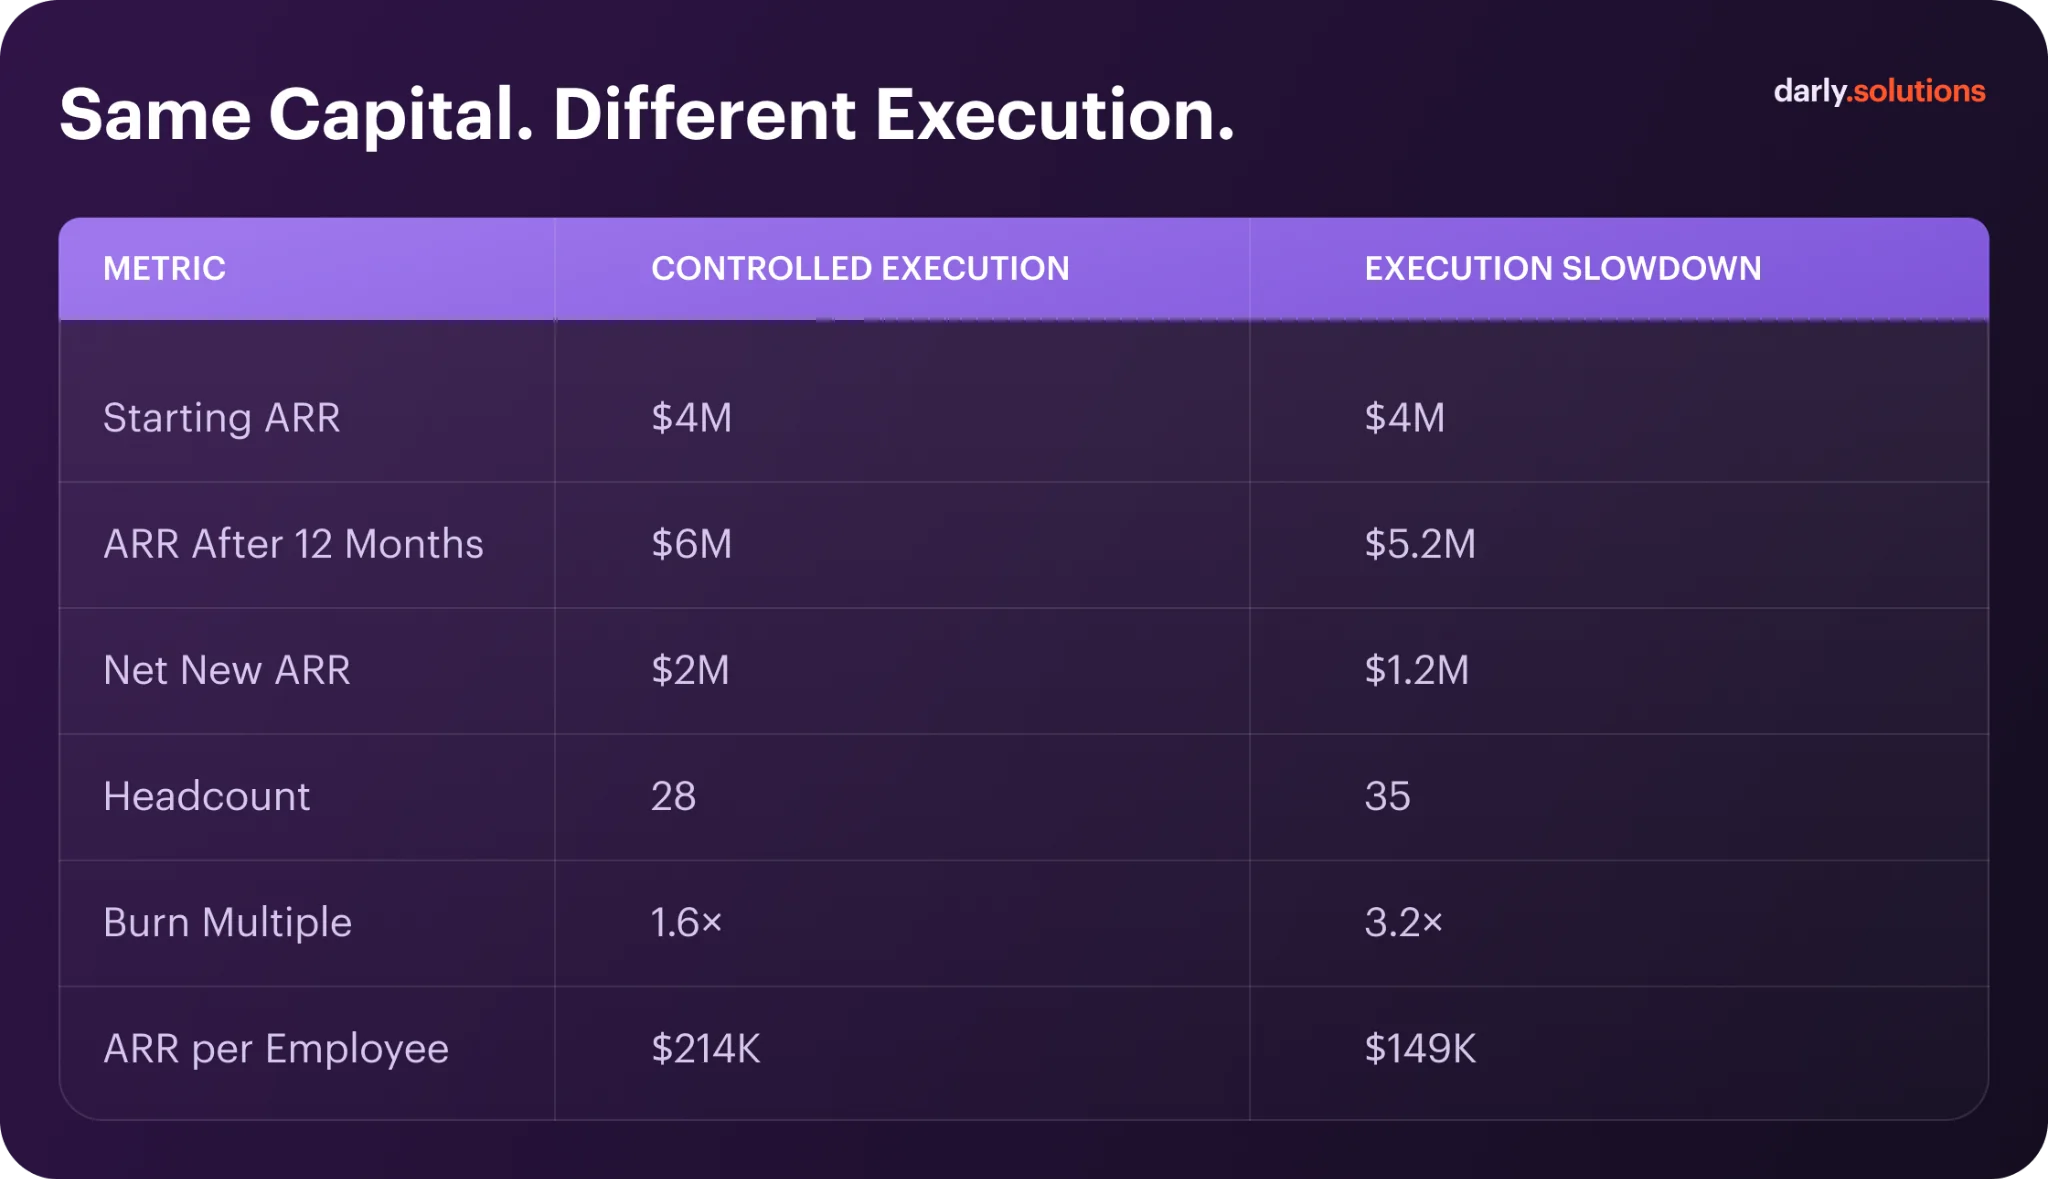
If a company adds headcount aggressively while net new ARR grows more slowly, burn multiple expands even if total ARR is rising.
For example:
- $3M ARR
- $2M annual net burn
- $1M net new ARR
Burn multiple = 2.0×
If hiring pushes burn to $3M while net new ARR remains $1M:
Burn multiple = 3.0×
Revenue still grows, runway compresses materially. Because runway depends on net burn, even moderate deterioration in burn efficiency can reduce financing flexibility within 2-3 quarters, without any obvious revenue crisis.
2. ARR per Employee
Revenue per employee (ARR/FTE) functions as a scalability signal.
- Industry SaaS benchmarks commonly place early-stage companies ($1–5M ARR) in the ~$100K–$200K ARR per employee range.
- More mature SaaS ($5–10M+ ARR) typically trend higher as operating leverage improves.
Investors do not expect a fixed number, they expect directional improvement.
When team size expands from, say, 15 to 35 employees and ARR/FTE remains flat, the implication is that scaling product development and GTM capacity are not translating into proportional revenue output.
This affects valuation indirectly. Growth-stage SaaS multiples are heavily influenced by growth rate and efficiency (Rule of 40 frameworks, Bessemer efficiency score). If ARR grows while revenue per employee stagnates, operating leverage assumptions weaken.
Execution scale is measured by whether each incremental hire produces incremental recurring revenue.
3. Cost of Delay
Cost of Delay economics (Reinertsen, Principles of Product Development Flow) formalize that value is time-sensitive. In subscription SaaS, the impact compounds because recurring revenue builds month over month.
If an expansion feature capable of generating $50K MRR ships six months late, the lost value is not a single $50K shift. It is six months of missed compounding subscription revenue.
Example:
- Feature expected to generate $50K MRR.
- 6-month delay.
- Lost revenue ≈ $300K in unrealized recurring inflow before compounding effects.
That revenue is not “pushed forward.” It disappears from the cumulative ARR trajectory.
DORA research further shows that organizations with shorter lead times and higher deployment frequency correlate with stronger organizational performance outcomes. Slower execution reduces the frequency at which monetizable increments reach customers.
For a $3–5M ARR SaaS preparing for Series B, a two-quarter delay on a major expansion lever can materially alter ARR trajectory at fundraising time.

Execution slowdown does not usually create visible panic. It changes efficiency ratios quietly:
- Burn multiple expands.
- ARR per employee plateaus.
- Expansion revenue compounds more slowly.
Over 12-18 months, these effects accumulate into lower operating leverage and tighter capital conditions, even while headline ARR continues to rise.
The Impact on Growth and Retention
Execution dynamics shape revenue compounding long before top-line metrics signal stress. After capital infusion, investors monitor how quickly roadmap decisions convert into expansion revenue, stronger retention, and sustained growth. When delivery cadence changes, the effect moves through retention quality, sales velocity, and competitive positioning.
Expansion Momentum and NRR
Expansion revenue depends on continuous value delivery. In growth-stage B2B SaaS, Net Revenue Retention reflects how effectively new capabilities translate into account expansion.
Series A companies often target NRR above ~110%, while companies approaching Series B frequently exceed ~120%. When expansion features arrive later than planned, NRR trends toward the 100–105% range. Revenue remains stable, yet expansion intensity moderates. Cross-sell and upsell motions require a stronger commercial effort to achieve similar outcomes.
This pattern frequently appears during post-Series A slowdown, when feature cadence shifts from proactive expansion to backlog catch-up. Over time, flatter NRR reduces compounding growth across cohorts.
Product Velocity and ARR Growth
Recurring revenue growth depends on how consistently monetizable increments reach customers. Faster release cycles enable earlier pricing experiments, integration depth, and onboarding improvements.
Sustained 2-3× annual growth in the $1–10M ARR range typically requires disciplined product execution after Series A, where roadmap translation into usable value remains steady as headcount expands.
When release intervals extend, revenue still increases, yet growth curves begin to bend. Expansion deals close later. New verticals open slower. Monetization experiments shift into future quarters.
Over a 12–18 month window, these delays accumulate into slower ARR acceleration and narrower margin for strategic reinvestment.
Sales Cycle Expansion
Commercial teams operate on perceived delivery confidence. When roadmap timelines extend, sales motions increasingly reference upcoming functionality rather than existing capabilities.
In B2B SaaS, average sales cycles in early growth often span 60-120 days. Delivery uncertainty stretches that duration as buyers request additional validation or phased commitments.
This dynamic frequently emerges during periods of product development slowdown after funding, when scaling complexity reshapes release predictability.
Longer sales cycles influence:
- Forecast reliability
- CAC payback timelines
- Pipeline conversion velocity
Revenue continues to grow, yet deal flow becomes less fluid and more conditional.
Market Velocity vs Product Velocity
Category momentum amplifies through iteration speed. Companies that maintain consistent release cadence refine positioning faster, respond to customer feedback earlier, and deepen integration value over time.
When market evolution outpaces internal delivery speed, competitive advantage narrows gradually. Renewal conversations focus more on pricing comparisons and feature parity rather than differentiation.
This dynamic represents one of the less visible startup growth challenges after funding. Growth capital increases opportunity surface area. Execution tempo determines whether that opportunity converts into durable expansion.
Execution cadence influences retention strength, ARR trajectory, and commercial predictability in subtle but cumulative ways. Growth compounds fastest when expansion features, sales confidence, and market positioning evolve in alignment.
Why This Becomes a Fundraising Risk
The transition from Series A to Series B marks a structural shift in investor evaluation. Early capital supports validation and initial market traction. At the next stage, investors assess whether the organization can scale execution predictably and efficiently.
When a product development slowdown after funding emerges, the risk profile of the company changes. Revenue may continue to grow, yet the mechanisms that generate growth begin to lose stability.
1. Predictability of Growth
Investors at Series B prioritize stability of revenue expansion over isolated high-growth quarters. Sustainable growth after raising capital must appear engineered rather than episodic.
When roadmap timing shifts or monetization initiatives move between quarters, forward projections lose precision. Expansion revenue becomes uneven, and quarterly acceleration varies. Even if ARR increases annually, inconsistent cadence reduces confidence in forecast reliability.
Predictability signals operational control, and variability signals execution exposure.
2. Capital Efficiency Signals
Capital efficiency metrics: burn multiple, ARR per employee, CAC payback, reflect the organization’s ability to convert spend into recurring revenue. These indicators become central when evaluating product execution after Series A.
If hiring continues while monetizable releases slow, burn expands relative to incremental ARR. Revenue per employee plateaus, and operating leverage fails to improve at scale.
The issue is directional rather than absolute. Series B investors expect efficiency gains as scale increases. When those gains do not materialize, the underlying concern becomes whether the organization is effectively scaling product development or merely scaling headcount.
3. Expansion Quality and Revenue Composition
Net Revenue Retention reveals whether expansion is structurally embedded in customer workflows. Strong NRR demonstrates that revenue compounds internally through upsell and cross-sell motions.
When product velocity weakens and expansion features ship later than planned, growth composition shifts. Retention may remain stable, yet expansion intensity softens. This dynamic represents one of the less visible post-funding product development issues that affects investor perception.
Growth driven primarily by acquisition appears more fragile than growth reinforced by internal expansion. Investors discount fragility.
4. Execution Risk as the Dominant Investment Risk
By Series B, product-market fit and market demand are assumed to be materially validated. The primary question becomes whether the organization can scale complexity without degrading output.
When a post-Series A slowdown becomes persistent, through recurring roadmap slippage or delayed monetization cycles, execution risk replaces market risk as the central investment concern.
The discussion shifts from opportunity size to operational discipline.Investors evaluate whether the company maintains control over its delivery process or responds reactively to internal friction.
Valuation Implications
Valuation at Series B reflects forward visibility. Multiples are based on confidence in sustained revenue expansion, durable retention, and improving capital efficiency.
The hidden cost of slow product development is not immediate revenue contraction. It is the gradual reduction of certainty around future trajectory. Lower certainty narrows negotiation leverage and compresses valuation bands.
Revenue can continue to rise while valuation sensitivity increases. In growth-stage fundraising, predictability and execution control determine pricing power as much as topline performance.
Final Thought
After Series A, the company shifts from building a product to operating a delivery system. Revenue growth depends on how reliably roadmap decisions turn into monetizable releases.
When execution slows at this stage, the impact extends beyond feature delays. Capital efficiency tightens, expansion momentum moderates, and forecast confidence narrows. Strategic flexibility reduces before financial metrics visibly react.
Slow product development after funding signals that scaling complexity is outpacing operational structure. By the time the imbalance appears in valuation discussions, the adjustment window is smaller.
If you want an external perspective on how your delivery system performs under scale, contact us to review your current execution model and identify where structural friction limits growth. See how we've done it for others

FAQ
A short adjustment period is common as teams expand and processes formalize, yet a sustained product development slowdown after funding usually indicates that operational complexity is increasing faster than delivery capacity. Controlled scaling strengthens predictability and ownership; structural friction reduces throughput and gradually weakens execution quality.
When startup execution speed declines while hiring and operating costs continue to rise, burn multiple expands even if ARR grows. Slower monetization reduces net new ARR relative to spend, which shortens runway and limits financing flexibility over successive quarters.
In most cases, slow delivery reflects system design rather than individual performance. As companies scale, coordination load, approval layers, and cross-functional dependencies intensify; without deliberate evolution of the operating model, scaling product development becomes less efficient and output per contributor moderates.
The hidden cost of slow product development emerges in capital efficiency, retention strength, and valuation sensitivity. Expansion revenue compounds at a slower pace, ARR per employee flattens, and forecast reliability weakens, gradually reshaping growth expectations long before revenue contraction appears.
Related articles
.webp)


Connect with us
.webp)
We are a tech partner that delivers ingenious digital solutions, engineering and vertical services for industry leaders powered by vetted talents.