


.svg)

Project overview
Video conferencing is a lifesaver for organizations with large distributed teams worldwide. However, this is true only if the tool of choice works smoothly: there is no unexpected downtime or dips in performance at peak times.
Keeping track of hundreds or thousands of video calls to optimize performance and quickly pinpoint issues can easily become a drag on developers’ limited resources. For our client, a U.S. startup called Agent Walrus, there was an obvious solution: a web platform that tracks stats for video calls at scale and alerts developers about issues as they arise.
However, as a data-heavy SaaS web platform, Agent Walrus would need a fast, responsive front end with intuitive, highly customizable real-time data visualizations.
Client’s Review
Services


Challenges
Our client took on UI/UX design and backend development. We, in turn, were tasked with translating existing wireframes and prototypes into a functional frontend and integrating it with the backend.
Agent Walrus is a data-heavy SaaS product. So, our key challenge was minimizing refreshment latency for data visualizations while ensuring they were easy to navigate and comprehend. We also had to ensure optimal performance throughout the platform when processing dozens of metrics and thousands of video call sessions.
Since the platform offered diverse monitoring and analytics capabilities, comprehensive onboarding was also necessary. This involved not only the traditional setup workflow but also a demo app to help users understand the platform’s capabilities.
Our discovery phase outlined the key business needs and technical requirements for our project, including:
Strategic business needs
01 Deploy a video conferencing monitoring and analytics web platform with responsive data visualizations
02 Achieve an average monthly product sign-up growth of at least 15% within the first year
03 Keep the user churn under 15% within the first year
04 Reach a user satisfaction rate above 85% within the first year
Technical requirements
01 Develop the web platform’s frontend based on the client’s wireframes and prototypes
02 Integrate the frontend with the backend codebase and ensure seamless and secure flow of data between the two
03 Implement real-time data refreshment and visualizations with customization, search, and filter features
04 Limit the latency for data visualizations to 50 ms at all times
05 Ensure the application availability of at least 97.5%
06 Keep the average response time below 0.3 s
07 Secure a system usability scale (SUS) score of at least 85
Is analytics your SaaS product’s key value proposition?
We’ll ensure your product can visualize large volumes of data with ease while making user experiences delightful.

.avif) Talk to an expert
Talk to an expert.webp)
Solutions
We selected React, Typescript, and Redux to build a fast, responsive frontend to seamlessly update the displayed data in real time. This tech stack is also perfect for creating interfaces that support high request throughputs and large data volumes.
Our component-based approach to frontend development, along with iterative performance and scalability optimizations, bore fruit. The platform showed a 92 Apdex score, 99.9% application availability, <50 ms latency, and <0.3 s average response time.
As a result, our client received a data-heavy interface that was seamlessly integrated with the backend codebase. The web platform came equipped with the following capabilities:
- Sign-up, sign-in, and onboarding
- Demo calls for user training
- Individual session analytics with customizable charts and graphs
- Video conferencing tool analytics with customizable charts and graphs
- Continuous error monitoring and detection
- Data search and filtering


Sign-up and onboarding
Agent Walrus welcomes new users with a simple sign-up form that requires only a work email address and password. We added validation rules and error handling to make the process even smoother and prevent mistakes during data entry.
Once signed up and logged in, users are guided through entering their organization’s details and setting up their first metric-tracking app. When implementing this user flow, we paid extra attention to usability and error handling. It paid off: During user satisfaction assessments, users cited smooth onboarding as a strong advantage, contributing to a 91% satisfaction rate.

Demo app
The demo app allows users to take Agent Walrus for a test drive and learn the ins and outs of its inner workings before using it on an in-production video conferencing tool. This demo app demonstrates how Agent Walrus can track video call metrics and adjust settings like audio quality and video resolution.
This demo app makes the learning curve gentler and allows users to explore the full feature range. This promoted feature adoption across the board, all while helping limit the user churn to 7%.
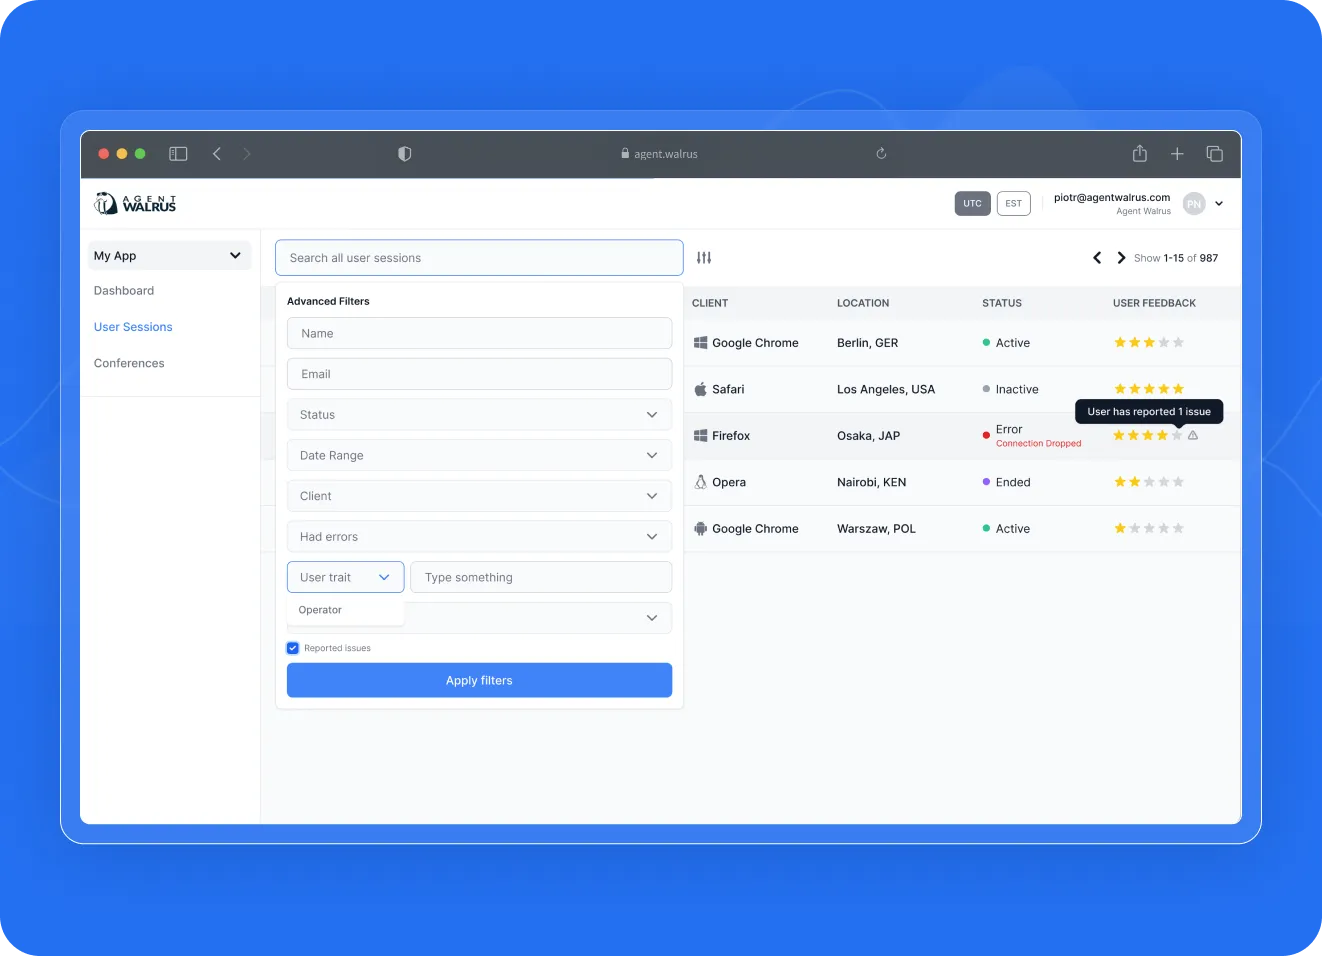
User sessions
This component provides users with a full overview of all video calls. The list displays participants' platforms and locations, call status, and user feedback. Thanks to comprehensive search and filters, the list is easy to navigate. For example, users can choose to view only active sessions or the ones where errors occurred.
We ensured the session list and information are seamlessly updated in real time, quickly displaying the latest changes without disrupting the user experience. We also added a connection matrix to provide users with a simple visualization of all connections and their statuses.

Session details
Agent Walrus allows users to review stats for every individual video call. A variety of charts and graphs display metrics like the bit rate received and packet loss rate throughout the call. Users can also view data about the call participants, their locations, used devices and platforms, browser versions, browser console outputs, and more.
The ensemble of this data provides development teams with a comprehensive overview of all data related to a specific video call. This enables better root-cause analysis for issues that may arise during the call. Our intuitive, customizable data visualizations streamline this analysis even further, strengthening the product's key value proposition.

Dashboard
The dashboard is where all session data for a specific video conferencing tool lives. The dashboard aggregates and visualizes the said data, allowing users to narrow it down with filters and custom date and time ranges. The data in question includes the number of user sessions, serious issues detected, and successful calls, displayed in widgets, charts, and graphs.
Some users may need to track real-time metrics, while others may want to investigate historical data. To meet the needs of both, we added the auto-refresh toggle, a refresh button, and an indicator of when the data was last updated.
As a result of our work, metrics get refreshed in real time without dips in performance or friction in the user experience. Early users also reported that the intuitive, customizable data visualizations on the dashboard helped them speed up issue resolution by 28%.

Search and filtering
Users can manipulate all data appearing on the dashboard and session pages with comprehensive search and filter settings. On the dashboard, for example, users can set custom date ranges or select predetermined intervals from a drop-down list. On the sessions page, users can narrow the list down with advanced filters like session status and date range.
While developing this interface part, we suggested several improvements based on user testing results. With our client’s approval, we introduced them, speeding up search and filtering, streamlining user experiences, and securing an 89 SUS score in the process.


Tech stack
Impact
Highly customizable data visualizations and consistently high performance allowed Agent Walrus to achieve:
Does your data-heavy SaaS platform need a fast interface?
We’ll minimize latency for data refreshment and average response time while driving user satisfaction with intuitive visualizations.
Contact usTestimonials

I love it! The team was thinking about the logic of the app first, instead of just making a code. They supported my vision.

I love it! The team was thinking about the logic of the app first, instead of just making a code. They supported my vision.
Anna Vashchuk
Startup Founder
Darly made me an app owner! The price we agreed is what I paid. I've already decided to work with them on my next project.
Darly made me an app owner! The price we agreed is what I paid. I've already decided to work with them on my next project.
Oliwia Kowalska
App Owner
We’ve been working together for over 2 years. Since then, our webpage has been ranking high on Google and bringing us leads.
We’ve been working together for over 2 years. Since then, our webpage has been ranking high on Google and bringing us leads.
Anastasiya Shitikova
Head of Marketing
We got the website ready and out of the gate in record time! Darly helps us maintain and refine the website for SEO purposes.
We got the website ready and out of the gate in record time! Darly helps us maintain and refine the website for SEO purposes.
Kavya Khattar
Product Owner
The responsiveness, attention to detail and high-level communication from Darly Solutions was outstanding. Communication with the team was all online and was absolutely seamless. They were highly responsive, worked to tight deadlines and provided great feedback and communication throughout the entire project to ensure it remained on schedule and all quality requirements were being met. They exceeded all of our expectations, from design through to delivery.

The responsiveness, attention to detail and high-level communication from Darly Solutions was outstanding. Communication with the team was all online and was absolutely seamless. They were highly responsive, worked to tight deadlines and provided great feedback and communication throughout the entire project to ensure it remained on schedule and all quality requirements were being met. They exceeded all of our expectations, from design through to delivery.
Kieran Donovan
Managing Director, Corporate Advisory Firm
LLC Darly Solutions's team performs well since the collaboration started. They are fluent in specific programming languages, they are also fluent in English, and they have a great response time. What is most unique and impressive about Darly Solutions is that everyone in the team is inherently communicative and understands the expertise of their respective fields. The team is very agile and can predict stress situations in which we work together to fix and maintain.

LLC Darly Solutions's team performs well since the collaboration started. They are fluent in specific programming languages, they are also fluent in English, and they have a great response time. What is most unique and impressive about Darly Solutions is that everyone in the team is inherently communicative and understands the expertise of their respective fields. The team is very agile and can predict stress situations in which we work together to fix and maintain.
Carol Arao
Product Owner, Software Development Company
Darly Solutions' work so far inspires confidence, as they're skilled and trustworthy. The health platform is incredibly happy with their work. The team at Darly is communicative, responsive, and responsible. I’d recommend them to people looking to do more than build a simple little software.

Darly Solutions' work so far inspires confidence, as they're skilled and trustworthy. The health platform is incredibly happy with their work. The team at Darly is communicative, responsive, and responsible. I’d recommend them to people looking to do more than build a simple little software.
Jürgen Bröker
Executive Director, Healthcare Platform Co.
By collaborating with Darly Solutions, there is a significant improvement in the project's quality of codes compared to their original codebase. They lead efficient project management and keep the client updated with their reports. They're a flexible team that delivers promising results. They don't just do as they're told, they actively participate in the design process, which is going to yield us a much better platform in the end.

By collaborating with Darly Solutions, there is a significant improvement in the project's quality of codes compared to their original codebase. They lead efficient project management and keep the client updated with their reports. They're a flexible team that delivers promising results. They don't just do as they're told, they actively participate in the design process, which is going to yield us a much better platform in the end.
PJ Fisher
Head of Tech, Software Consulting Firm
Darly Solutions was able to develop the site with all functions running. The team was responsive throughout the engagement. They excelled at scheduling and delivered projects on the specified timeline. The whole team was a pleasure to work with. I am very glad that I entrusted them with my project, this is the best company for me!

Darly Solutions was able to develop the site with all functions running. The team was responsive throughout the engagement. They excelled at scheduling and delivered projects on the specified timeline. The whole team was a pleasure to work with. I am very glad that I entrusted them with my project, this is the best company for me!
Inna Netudikhata
CEO, Mama Travel
The quality of their work is very high, and we get very good customer feedback on what our site looks like. They're very reliable and have a great overview of the technologies they're using. They meet our deadlines and are very accurate with their time estimations on a project. In addition, they're responsive and great with communication with a great command of English — it's very easy to talk to them. Moreover, we've integrated them into our development and scrum process, where we have daily stand-ups with their project manager and developers through Slack.

The quality of their work is very high, and we get very good customer feedback on what our site looks like. They're very reliable and have a great overview of the technologies they're using. They meet our deadlines and are very accurate with their time estimations on a project. In addition, they're responsive and great with communication with a great command of English — it's very easy to talk to them. Moreover, we've integrated them into our development and scrum process, where we have daily stand-ups with their project manager and developers through Slack.
Felix Leontyev
Head of Technology, PSS AG
LLC Darly Solutions are highly skilled at UI/UX and follow very good engineering standards, and have been very professional in its approach to all the work to date (including the initial consultancy, which was the deciding factor). They have taken ownership of the work in way that demonstrates how much they value the work they are doing and consequently the work we are doing. I am gaining confidence that the decisions they make are good decisions and that this will result in a product that will exceed our initial expectations.

LLC Darly Solutions are highly skilled at UI/UX and follow very good engineering standards, and have been very professional in its approach to all the work to date (including the initial consultancy, which was the deciding factor). They have taken ownership of the work in way that demonstrates how much they value the work they are doing and consequently the work we are doing. I am gaining confidence that the decisions they make are good decisions and that this will result in a product that will exceed our initial expectations.
Gordon Lang
CTO, Vidina Solutions Ltd
Darly Solutions developed the app in a quick manner, and the code quality was excellent. The professional team was committed to building a successful product. The code quality was good, and the app has been built in a little more than 1 month, which is a result I'm very happy with. They were laid back but professional at the same time.

Darly Solutions developed the app in a quick manner, and the code quality was excellent. The professional team was committed to building a successful product. The code quality was good, and the app has been built in a little more than 1 month, which is a result I'm very happy with. They were laid back but professional at the same time.
Piotr Nowakowski
Founder, 79 Characters, Inc.
Darly Solutions’ work helped my business tremendously. They were able to identify key areas for growth and improvement. The team was communicative and professional throughout the entire engagement. LLC Darly Solutions is a solutions-oriented vendor that drives results. They’re really professional and they know what they’re doing. The team knows how to identify my problems and solve them.

Darly Solutions’ work helped my business tremendously. They were able to identify key areas for growth and improvement. The team was communicative and professional throughout the entire engagement. LLC Darly Solutions is a solutions-oriented vendor that drives results. They’re really professional and they know what they’re doing. The team knows how to identify my problems and solve them.
Maiza Simeon
Founder, Food App Startup
Related case study

Connect with us
.webp)
We are a tech partner that delivers ingenious digital solutions, engineering and vertical services for industry leaders powered by vetted talents.