The engineering metrics every SaaS CTO should track (but doesn’t)


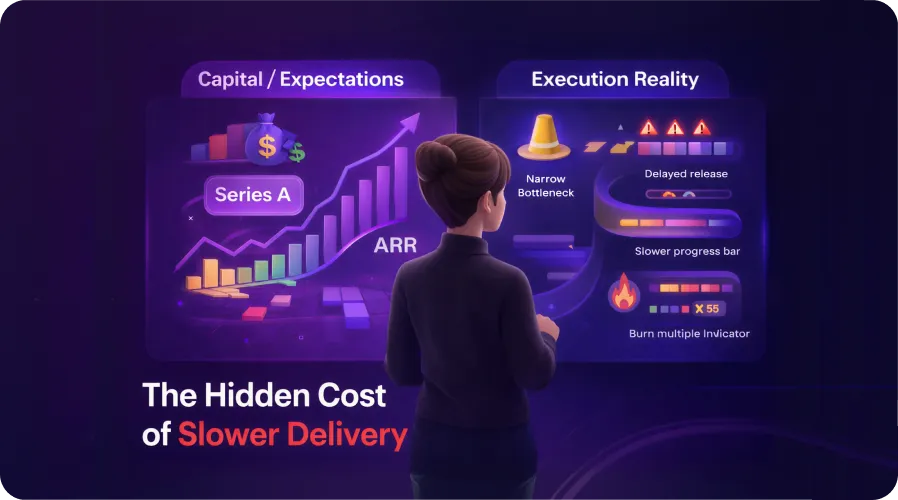
Delivery rarely breaks in a single failed release. For a CTO, the first signals are subtler: coordination cycles stretch, releases feel heavier, and the same roadmap items require more alignment than before. By the time deadlines slip, the root cause is already embedded in the delivery system.
After Series A, delivery begins to operate as a connected system rather than a compact team. Parallel initiatives, shared services, and ownership boundaries shape outcomes more than individual output. At this stage, engineering metrics for SaaS matter only when they explain how work flows, where risk accumulates, and how complexity alters delivery behavior.
This article examines the metrics that reveal these patterns early. It demonstrates how SaaS CTO metrics reveal delivery health, clarify risk, and support scaling decisions, rather than adding another layer of dashboard noise.
Introduction: why engineering metrics stop working after Series A
Before Series A, delivery metrics answer one question: are we shipping fast enough? A small team, shared context, and limited dependencies make output-based signals feel reliable.
After Series A, the focus shifts. Delivery now needs to scale across teams, systems, and commitments. Metrics must show whether capacity grows without amplifying risk. This is where many SaaS CTO metrics stop reflecting reality.
This shift typically shows up as:
- Rising team velocity
- Lower release predictability
- Slipping deadlines despite strong dashboards
- Incidents emerging closer to launch
The root cause stays the same: activity gets measured, while the delivery system stays invisible. Output shows movement inside teams. Risk accumulates in dependencies, ownership gaps, and coordination paths between them.
The cost of tracking the wrong things
When metrics focus on activity, the cost rarely shows up in dashboards first. It appears in missed expectations, growing delivery risk, and strained relationships with the business. Over time, the system keeps moving, while control slips away.
What a CTO gradually loses
- Predictability
Planning starts to rely on local output signals, while real delivery time stretches across reviews, dependencies, and shared platforms. Dates feel reliable early on, then collapse close to release. - Risk awareness
Throughput increases, yet failure patterns remain invisible. Hotfixes, rollbacks, and incident load grow inside the system without a clear signal of where the risk is accumulating. - Business trust
Product and sales plan around “done” statuses. Customers experience delays and instability. Confidence erodes between delivery teams and the rest of the organization.
How this shows up day to day
- Releases move late in the cycle and get labeled as “unexpected”
- Sales commits to functionality that exists on boards but lacks production readiness
- Teams absorb pressure through hero-mode: longer hours, firefighting, constant context switching
From the outside, the narrative sounds familiar: the team is falling behind. Inside the system, the pattern points elsewhere. Coordination, ownership, and flow carry the real load, yet remain largely unmeasured.
What SaaS CTOs usually track (and why it’s not enough)
After funding, many teams formalize the same dashboard. It feels structured, familiar, and easy to explain. Yet this view describes effort inside teams rather than how delivery behaves across the whole system — a common gap in engineering metrics for SaaS at this stage.
The typical set looks like this:
- velocity per sprint
- tasks or epics closed
- sprint burndown or burnup
- hours logged or capacity used
These metrics answer one question: how busy were teams inside their planning box? They stay silent on how work actually moves once it leaves that box.
What stays invisible with this setup:
- Delays between stages. Work waits in reviews, environments, approvals, and coordination loops that never appear on burndown charts.
- Cross-team dependencies. Features span multiple services and teams, while team-local metrics treat each stream as isolated.
- The price of mistakes. Rework, hotfixes, incidents, and recovery time blend into “completed tasks” without showing their real cost.
- Where delivery breaks. Bottlenecks emerge in shared platforms, ownership gaps, and integration paths, far from individual boards.
For a growing product, this gap matters. Velocity can rise while lead time stretches and hotfixes multiply. The dashboard shows progress, while the delivery system carries more risk with each release.
The metrics most teams don’t track (but should)
When SaaS leaders ask what metrics should SaaS CTO track, the instinct is often to add more numbers. At Series A, clarity matters more than coverage. A small set of well-chosen signals can explain where delivery strains and where scaling pressure builds.
For a 10–50 developer product company, four indicators usually matter most.
1. Time to release
(System flow)
Time from merge to production for a typical low-risk change.
This is one of the few engineering metrics for SaaS that immediately exposes friction across reviews, CI, environments, and deployment practices. When time to release stretches while sprint output looks stable, the constraint sits in the system, not in individual effort.
2. System reliability
(Stability under load)
Uptime, incident count, and severity trends.
Reliability connects delivery behavior to revenue and retention. If incident volume grows as parallel work increases, architectural or ownership gaps start to surface. These patterns matter more than short-term output shifts.
3. Delivery predictability
(Planned vs. actual scope)
How much committed scope lands within the planned window.
Among practical SaaS CTO metrics, predictability often reveals more than velocity. Consistent scope slippage signals dependency overload, unclear ownership, or review bottlenecks long before dashboards turn red.
4. Incident load per developer
(Sustainability)
Time spent on incidents versus roadmap work.
This dimension shapes whether growth translates into stable output or constant firefighting. For many scaling teams, it becomes the most honest of all engineering KPIs for SaaS startups — because it shows how much capacity is consumed by instability.
Together, these signals describe scaling capability. They show whether the delivery system converts parallel work into stable releases, how risk accumulates, and how much pressure the organization can absorb as complexity grows.
Metrics should answer business questions
At scale, numbers matter only when they change decisions. The role of a CTO shifts from tracking activity to managing risk, capacity, and predictability.
The core question is not “How fast are we moving?”
It is:
- Will this release ship on time?
- Where is risk increasing before it becomes visible?
- Can the team absorb more scope next quarter without destabilizing the system?
This is where engineering metrics for SaaS move from reporting to decision support.
Instead of long dashboards, focus on three business-aligned buckets.
1. Time to release → Can we commit confidently?
- Lead time for changes
- Delivery predictability (planned vs actual scope)
These signals show whether commitments translate into production outcomes. If scope regularly shifts or lead time expands, roadmap risk is already increasing.
2. System reliability → Is growth creating instability?
- Uptime
- Incident count and severity
- Change failure rate
- MTTR
Reliability metrics answer whether added parallel work increases customer impact. They translate directly into churn risk and NRR pressure.
3. Delivery capacity → Can we scale without burning out?
- Developer velocity and productivity
- Rework share vs roadmap work
- On-call load
These indicators show whether new initiatives expand output or simply redistribute pressure.
Among practical CTO metrics for SaaS, the right set is the one that directly informs trade-offs:
- Reduce scope or increase automation
- Add headcount or fix coordination
- Harden reliability before expanding sales commitments
When metrics map to business questions, they become levers. When they do not, they remain numbers on a dashboard.
The difference is whether they shape decisions before problems surface or explain them after.

Why velocity and output fail after Series A
After Series A, velocity alone no longer represents delivery reality. Output can look steady while predictability and reliability move in a different direction.
Why this happens
Local view
Velocity, story points, and tasks closed reflect activity inside a team. Delivery outcomes emerge across teams, shared services, and coordination paths.
Optimization inside the sprint
Re-scoping, slicing tasks smaller, or shifting work between iterations improves charts. Release timelines and production stability follow broader system dynamics.
Parallel work effect
As initiatives increase, coordination load expands. Velocity may stay consistent while overall cycle time stretches.
What velocity misses
System reliability
Uptime, incident count, and recovery speed define customer experience. These signals describe how the product performs under change.
Delivery predictability
Planned versus actual scope reveals whether commitments translate into shipped outcomes. This signal surfaces drift before roadmap pressure becomes visible.
Effective productivity
Output blends roadmap work and rework into one number. When a larger share of capacity goes into fixes and incident response, business throughput shifts even if sprint metrics remain steady.
Velocity supports local planning. Reliability and predictability describe how the delivery system converts effort into stable, repeatable outcomes at scale.
What “good” looks like for a Series A SaaS
Growth is sustainable only when execution remains predictable as scope and coordination expand.
At this stage, “good” reflects controlled growth. The organization runs more initiatives, coordinates across more stakeholders, and evolves shared services while maintaining predictability. As parallel work expands and dependencies multiply, changes affect a broader part of the system — yet releases land within planned windows, recovery stays fast, and commitments reach production. This is what maturity looks like: complexity rises, execution remains steady.
For a 10–50 developer B2B SaaS, three indicators usually define that state:

These are grounded engineering metrics for SaaS because they translate technical behavior into business confidence. Release time reflects flow. Reliability reflects risk control. Predictability reflects organizational alignment.
See how we've helped B2B SaaS teams reach this state
Common CTO mistakes with metrics at scale
As teams grow, CTO metrics for SaaS often stay anchored in small-team logic. Metrics still exist, dashboards look busy, yet delivery becomes harder to predict. The issue rarely sits in execution. It sits in how metrics are used.

Final thought
As delivery expands, the CTO role evolves from tracking activity to shaping capability. Execution must stay predictable while scope, headcount, and coordination grow.
Clear SaaS CTO metrics create three practical advantages:
Steering growth — seeing how added initiatives and teams influence flow and reliability.
Aligning with the business — connecting delivery signals to predictability, revenue exposure, and burn efficiency.
Acting early — identifying constraints while they remain manageable and adjusting before commitments shift.
Well-chosen signals turn delivery into a controlled, scalable capability that supports confident decision-making.
If your current metrics no longer explain what’s happening in production, book a 15-minute call. We’ll help you pinpoint where the system is tightening and what to address first.

FAQ
Most teams start with development team metrics such as velocity, burndown, and tasks closed. These metrics help with short-term planning inside teams, yet they describe activity rather than how delivery works across the system.
Delivery issues appear earlier in software engineering metrics that capture end-to-end behavior: lead time for changes, deployment frequency, change failure rate, and MTTR. These metrics reveal where flow slows down and where risk accumulates before deadlines slip.
Yes. When CTOs use technical metrics that focus on flow and recovery, teams ship smaller changes more often and fix issues faster. This feedback loop supports steady release cadence and lower operational risk over time.
A rethink is needed when output looks healthy yet releases slip, incidents grow, or trust with the business erodes. These signals show that current metrics for SaaS engineering teams describe effort, while system constraints and scaling limits remain hidden.
Related articles

.webp)
Connect with us
.webp)
We are a tech partner that delivers ingenious digital solutions, engineering and vertical services for industry leaders powered by vetted talents.