
Key Metrics for Health Apps Success: A Guide to KPIs and Outcomes


According to Statista, revenue in the global digital health market is showing steady growth by nearly 7% (CAGR 2025-2029). Meaning the current amount of $197.88 bn will reach about $260 bn in 4-5 years. This forecast promises a massive business opportunity – but only for apps that move beyond standard metrics and deliver on real outcomes.
Download count, for example, isn’t the only important metric. A high install figure is a good sign. But without sustained engagement, proven clinical impact, and a growth strategy – even the most downloaded app will be at risk. To capture lasting success and truly improve patient care, you need to focus on the right key metrics for health apps, effective healthcare app analytics, and thorough healthcare app data tracking from day one.
In this guide, we’re going to explore the most impactful performance indicators that go beyond installs and daily active users. For your convenience, they are split by category: user engagement, retention and churn, acquisition and growth, feature and content engagement, user satisfaction, clinical impact, as well as operational and financial metrics. We’ll also explore mobile medical app performance indicators and health app ROI tracking.
Why Digital Health KPIs Matter
Unlike consumer apps, healthcare products operate in an industry with reliability, regulatory adherence, measurable patient benefits, great UX, and user engagement on top. That’s why here all key performance indicators aren't optional extras. Digital health KPIs are essential tools which turn raw data into actionable guidance.
By quantifying clinical outcomes, user behaviors, and system performance, you can gain the clarity needed to drive efficiency, ensure compliance, and continuously optimize your app’s impact. Without these data-driven patient engagement metrics and targeted healthcare KPIs – even the most innovative digital health solution risks missing the mark on patient safety, real-world value, and commercial success.
Key Healthcare App Success Metrics to Track
Before starting with feature roadmaps or marketing campaigns, it’s critical to establish the metrics that matter most. The right KPI for health app should give a 360-degree view into user behavior, patient outcomes, revenue, and compliance – ensuring your app delivers value at every level.
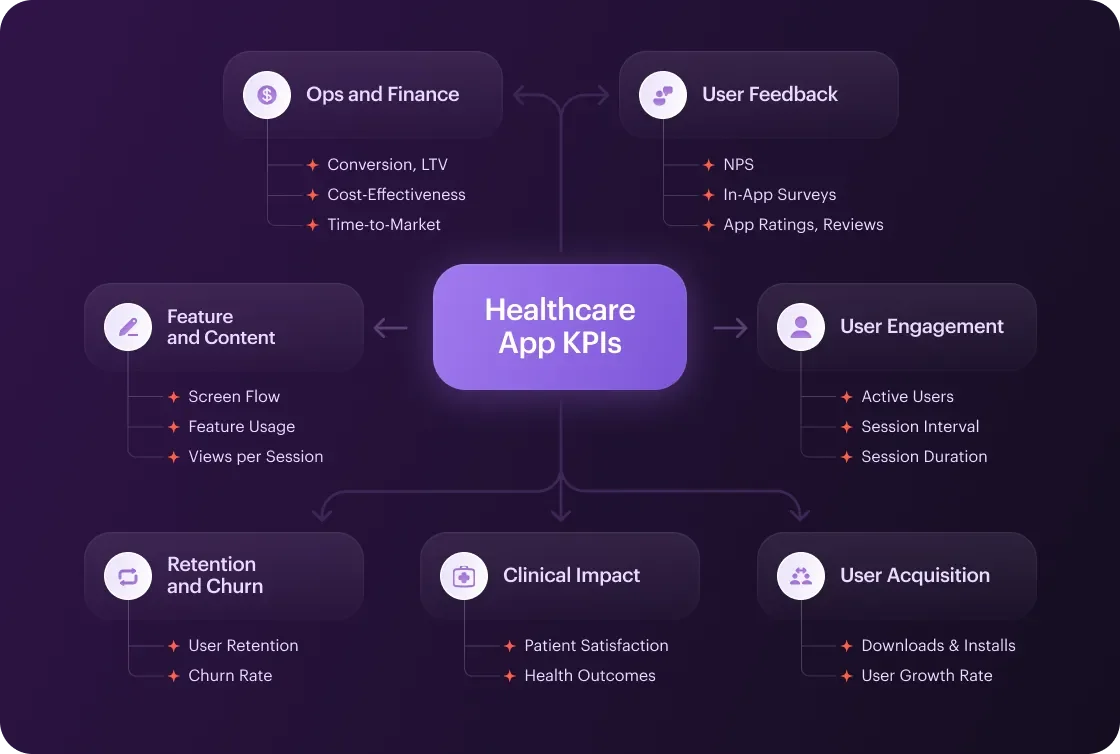
Here’s a short list of key metrics for digital health apps and benchmarks to track:
- User engagement (active users, session interval & duration)
- Healthcare app churn rate & retention (user retention and churn rate, cohort analysis)
- User acquisition (downloads & installs, user growth rate, and more)
- Feature and content (screen flow, feature usage, views per session, heatmap)
- Feedback (App store ratings & reviews, NPS, in-app feedback, surveys)
- Clinical impact (patient satisfaction, health outcomes, reduction in ER Visits)
- Operational and financial metrics (Time-to-Market, LTV, cost-effectiveness, conversion).
1. Clinician and Patient Engagement Metrics
Tracking how – and how often – users interact with your app is the first step toward understanding true product adoption and “stickiness.” Particularly in healthcare, high engagement often correlates with better adherence to care plans and improved outcomes. Here are the core engagement health app performance KPIs to monitor:
Daily Active Users (DAU) & Monthly Active Users (MAU)
Daily Active Users are about unique users who open the app or perform a meaningful action on a given day. In the same way, MAU represents unique users over a 30-day window.
You can use DAU and MAU to gauge overall reach and visibility. These metrics reveal whether users find ongoing value in quick check-ins (e.g., logging blood glucose) or are more involved in tasks (e.g., completing a telehealth visit).
DAU/MAU Ratio (Stickiness)
Stickiness is the percentage of your monthly user base that returns on a daily basis (DAU divided by MAU).
A higher ratio (ideally 20% or above) indicates a habit-forming product. This can help spot early signals of lowering engagement and prioritize feature improvements or reengagement campaigns.
Session Duration
Session Duration is the average time a user spends per session – from app open to close.
Longer sessions often reflect deeper engagement with core features (e.g., reviewing personalized health reports or completing guided exercises). At the same time, however, excessively long sessions in clinical-monitoring apps could also flag usability hurdles – so context is key.
Session Interval
Session Interval is the average time between two consecutive sessions for the same user.
Short intervals (daily or multiple times per day) are desirable for habit-based functions like medication reminders or symptom logging. Longer intervals may signal drop-off or insufficient value delivery between uses.
2. Retention and Churn
Keeping users engaged over time is the hallmark of digital health app success. High initial download and engagement numbers mean little if users disappear after a week or two. The following healthcare app churn rate KPIs can help you understand who’s engaged – and why.
User Retention Rate
Retention Rate is the percentage of users who continue to use your app after a defined period (e.g., Day 7, Day 30, Day 90).
High retention rate shows that your app delivers ongoing value – whether through reminders, insights, or continual clinical support. Tracking multiple time horizons (1-week, 1-month, quarterly) can help you pinpoint exactly when the drop-off happens.
Churn Rate
As the opposite of Retention, Churn Rate is a percentage of users who stop engaging with your app during a given period.
A high churn rate can indicate usability issues, a lack of compelling content, or unmet clinical needs. Monitoring churn alongside retention helps you prioritize the most critical UX improvements or bug fixes.
Check out the full impact and reasons for User Retention in healthcare apps. Learn how to reduce churn and keep clinicians & patients engaged with the right strategy.

 READ FULL GUIDE
Cohort Analysis
These metrics suggest grouping users by the date they signed up (or by behavior segments) to measure patient engagement in app and track engagement over time.
Cohort Analysis gives you a clear view of how changes – like a new onboarding flow or a feature launch – impact user behavior. You can compare, for example, the Week 1 retention of users who already tried a new onboarding flow vs. those who didn’t.
3. User Acquisition & Growth
Growing your user base is the gateway to scale – but in healthcare, quality often matters more than quantity. These key metrics for health apps in acquisition balance volume with value:
Downloads & Installs
Downloads and Installs represent the raw count of app downloads from app stores or direct links, and the number of successful installs.
These numbers serve as a top-of-funnel indicator – how many people you are reaching with marketing and organic visibility. Tracking downloads vs. installs also helps you diagnose technical or onboarding blockers.
User Growth Rate
This is a percentage increase (or decrease) in total active users over a given period (weekly, monthly, quarterly).
User Growth Rate highlights momentum: a steady upward trend is a signal of healthy market demand. Whereas plateaus or declines are a sign of stagnation or competitive pressure.
Extra Healthcare App Business Metrics to Look for:
Cost Per Install (CPI): Total marketing spend divided by the number of new installs – vital for budgeting paid campaigns
Organic vs. Paid Ratio: The split between users who find your app through non-paid channels vs. paid channels & ads.
Virality & Referrals (K-factor): How many new users each existing user generates through invites or social sharing.
Download Source Attribution: Breaks down installs by channel so you can focus on the highest-ROI sources.
4. Feature and Content Engagement
Beyond overall app usage, it’s crucial to understand how users move through the interface and which UI/UX features or content resonate most. These digital health KPIs reveal where you’re delivering value – and where you may need to iterate.
Screen Flow & Feature Usage
Tracks the most common navigation paths users take – e.g., Home → Symptom Log → Insights Dashboard – as well as the frequency of specific feature interactions (telehealth calls, medication reminders, educational modules).
Identifies your app’s “power paths” that lead to desired outcomes (completing a care plan, scheduling a follow-up) and highlights dead ends or under-utilized features that may confuse or frustrate users.
Average Screen Views per Session
The average number of distinct screens a user visits in a single session.
A higher count can signal deep exploration of content – great for education-driven apps – but may also point to navigation complexity. Conversely, very low counts might mean users aren’t discovering key functionality.
Heatmaps and Interaction Density
Visual overlays of user taps, swipes, scrolls, and pauses within your app’s UI, typically generated by analytics platforms.
These maps show “hot” areas of interaction and “cold” zones that are rarely tapped or explored.
“A well-thought-out UX audit can uncover hidden usability issues – buttons that look clickable but aren’t, important features buried out of view, confusing layouts that impact task flow, and many more. We recommend focusing on these friction points early – so that you can optimize the interface for smoother navigation and higher overall engagement from day 1.” – Bogdan Paiuk, Head of Delivery
5. User Satisfaction and Feedback
Measuring how users feel about the app – and acting on their input – is critical for building trust, improving usability, and driving word-of-mouth growth. Key healthcare app success metrics here include:
App Store Ratings & Reviews
The average star rating (out of 5) and written reviews left by users in the Apple App Store, Google Play Store, or other marketplaces. High ratings and positive reviews boost credibility and visibility in store rankings (Social proof).
Recurring complaints about crashes or confusing features can alert you to issues that need immediate fixes (Early warning). Users often suggest improvements or new ideas in reviews – tapping into this can inform your roadmap (Feature insight).
Net Promoter Score
A simple survey asking users, “On a scale of 0-10, how likely are you to recommend this app to a colleague or friend?” Calculated as the percentage of Promoters (9-10) minus Detractors (0-6). A high NPS correlates with strong word-of-mouth growth and user advocacy.
We recommend comparing NPS across user cohorts (new vs. power users, free vs. paid) to reveal where sentiment is strongest or weakest. Healthcare apps can benchmark NPS against industry averages (often between +20 and +40) to assess competitive positioning.
In-App Feedback & Surveys
Contextual prompts – like pop-up surveys after completing a telehealth visit or finishing a learning module – capture real-time impressions and surface pain points when they’re freshest.
You can effectively use multi-question mini-surveys – or even single-question thumbs-up/down prompts. This can help you capture user sentiment, usability issues, and feature requests.
6. Health Outcomes & Clinical Impact
In digital health, success isn't just about user numbers – it's about measurable improvements in people’s health. These healthcare product KPIs focus on the clinical effectiveness of your app and how well it supports patient well-being, adherence, and satisfaction.
Patient Outcomes
Objective, quantifiable improvements in a user’s health as a result of using your app – such as lowered blood pressure, improved HbA1c levels, reduced anxiety scores, or fewer hospital readmissions.
These metrics can be tracked through self-reported data, device integrations, or clinician-reported outcomes. They are also key to unlocking reimbursement models and long-term partnerships in the healthcare ecosystem.
Patient Satisfaction
A subjective measure of how users perceive the quality of care, communication, and overall experience they receive through your app. Typically gathered through surveys or questionnaires (e.g., “How satisfied were you with your care today?” on a 1-5 scale).
Patient satisfaction influences retention, adherence, and referrals. In value-based care models, it’s also tied to provider performance and reimbursement. High satisfaction can serve as both a competitive advantage and a sign that your digital workflows are meeting user expectations.
Reduction in ER Visits or Readmissions
The percentage decrease in emergency room visits or hospital readmissions among app users over a defined period.
One of the clearest indicators of clinical and economic impact. Lower use means better preventive care, improved patient self-management, and measurable value to healthcare systems and insurers.
7. Operational and Financial Metrics
Behind every successful healthcare app is a product that’s not only clinically effective but also operationally efficient and financially sustainable. These digital health KPIs help you understand how well your app performs as a business – ensuring you can scale, adapt, and deliver value over the long term.
Time to Market
The total time it takes to design, develop, test, and launch your healthcare app – from concept to release.
The ability to move quickly and safely is more than a competitive advantage. Shorter time to market allows you to validate ideas faster, capture emerging demand, and adapt to regulatory or patient needs in real time – without compromising compliance or quality.
Get from prototype to production in weeks, not months. We handle UX/UI design, front‑ and back‑end development, and regulatory compliance – so you can focus on strategy and patient impact.
CONTACT US
Cost-Effectiveness
A measure of the value delivered by your app relative to the cost of providing it. This could include cost per successful treatment, cost per engaged user, or overall savings compared to traditional care (e.g., fewer hospital visits or shorter recovery times).
Demonstrates that your app can deliver meaningful health outcomes without inflating costs – a key selling point for healthcare providers, insurers, and public health systems. High cost-effectiveness also supports long-term viability and favorable ROI.
Conversion Rate
The percentage of users who take a desired action – such as signing up after a trial, subscribing to a paid plan, or upgrading to a premium service (Converted Users / Total Users in Funnel x 100).
Tracks how effectively your onboarding, pricing, and product experience drive users toward key business goals. A low conversion rate could signal unclear value propositions, friction in the sign-up flow, or pricing misalignment with expected value.
Lifetime Value (LTV)
The total expected revenue generated by a user throughout their entire relationship with your app.
Helps you forecast revenue, justify acquisition spending, and evaluate business sustainability. A high LTV indicates strong user retention, successful monetization, and a loyal user base – especially important when pitching to investors or partners.
Aligning Healthcare Product KPIs with Business Goals and Stakeholder Needs
Healthcare executives must tie key metrics for health apps to the company’s global mission and current business objectives. Early on, the goal may be proving clinical validity and user fit, while later it shifts to market share, revenue, or profitability – so choosing the right KPI for health app is crucial at every stage.
For example, during launch, a startup may track adoption and pilot outcomes as core health app engagement metrics. Whereas in growth stages, you should emphasize sales, partnerships, or CAC and LTV metrics to align with broader health app performance KPIs.
Aligning expectations is critical in digital health: healthcare app success metrics that impress an investor (e.g., cost savings, patient retention) often take longer to materialize than consumer app metrics. Startups should therefore balance early wins (user sign-ups, engagement) against long-term healthcare product KPIs (improved health outcomes) so leadership and investors stay aligned.Executives should select a balanced mix of KPIs that reflects all stakeholder needs. Track financial and operational measures alongside clinical and patient-centric outcomes. Use both leading and lagging indicators: early adoption or satisfaction (leading) and later-rigor measures like readmission rates or symptom scores (lagging).
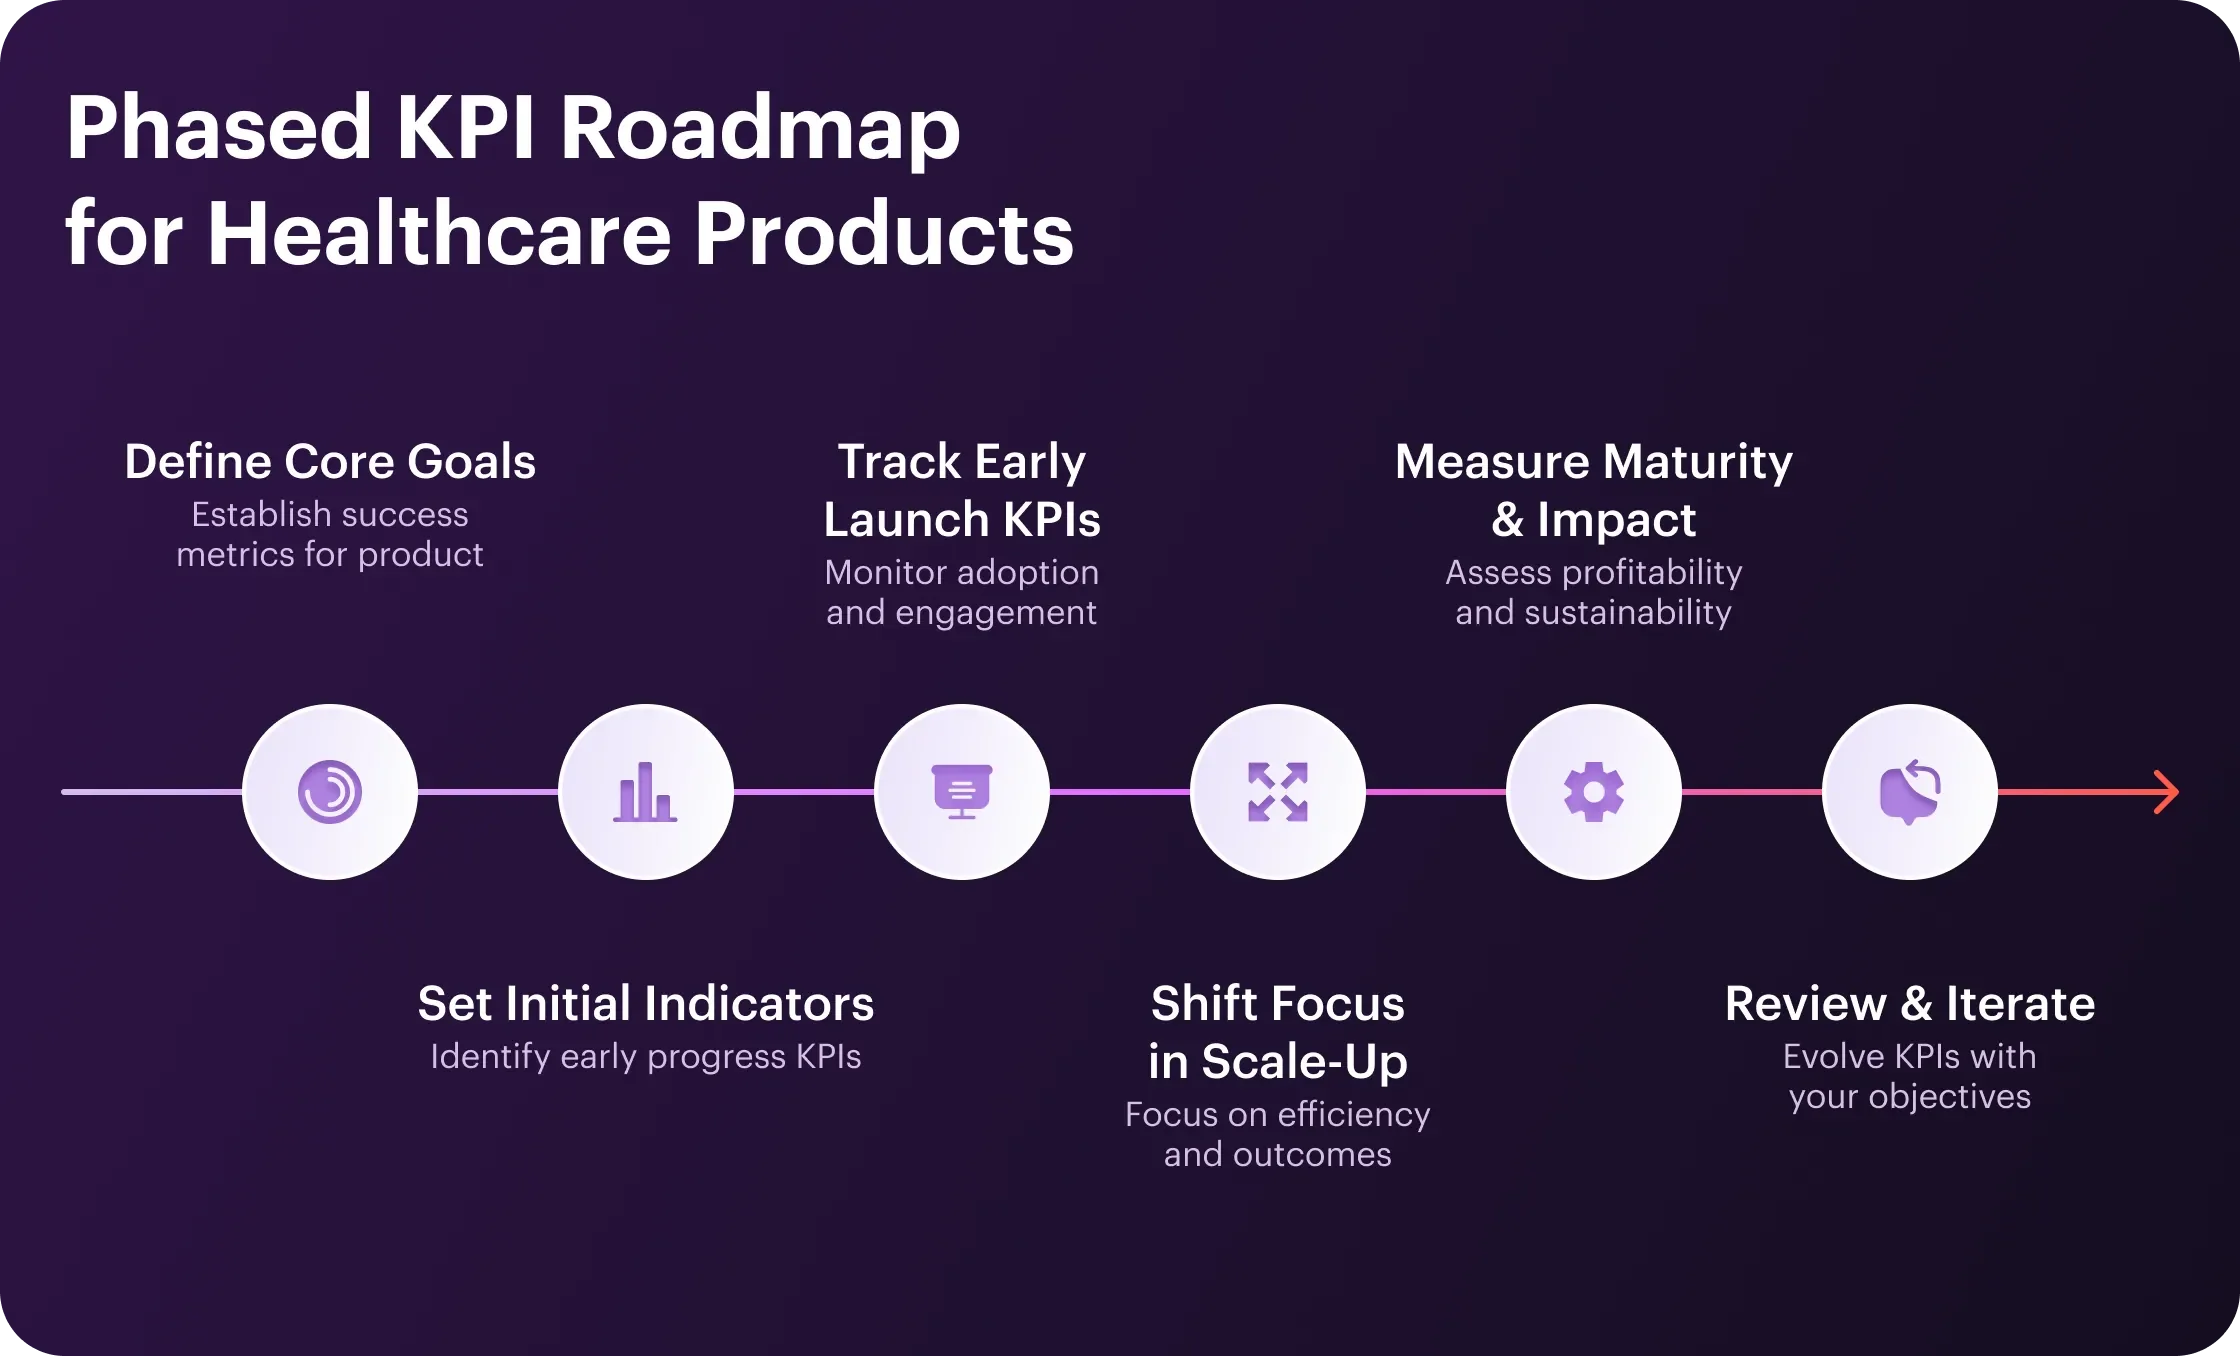
Phased Roadmap for Health App Performance KPIs:
Align Metrics to Each Stage of Your Product Lifecycle
1. Define Your Core Goals
Start by listing what success looks like for the product (e.g., improved patient outcomes, rapid user growth, or profitable partnerships). Map each goal to measurable health app engagement metrics. For example, if clinical impact is key – track patient adherence or health scores. If user growth matters – focus on signups and activation. Balance this with stakeholder needs: investors and payers value cost savings and outcome metrics, while clinical providers value safety and patient satisfaction.
2. Set Initial (Leading) Indicators
In the pre-launch phase, establish leading key metrics for digital health apps that show early progress. These may include prototype testing results, clinician feedback, beta user engagement, or approval milestones. Keep the list short (4-10 metrics) and aligned with strategy. Engage stakeholders (clinicians, regulators, patient advocates) in this stage to ensure you’re measuring what truly matters in healthcare.
3. Track Early Launch Metrics
Once live, focus on adoption and early engagement. Here, core health app performance KPIs include active user count, daily/monthly engagement, feature usage, and Net Promoter Score. Collect qualitative feedback to refine the product. Don’t chase revenue too soon; prioritize learning and evolution. Over-emphasizing sales during early testing can “overshadow vital user feedback and insights”.
4. Shift Focus in Scale-Up
When product-market fit is confirmed, it’s time to focus on healthcare product KPIs aimed at growth efficiency and outcomes. Track customer acquisition cost (CAC), monthly recurring revenue (MRR), retention/LTV, and partnership pipelines. Also monitor key clinical or engagement outcomes (e.g., symptom improvement rates, sustained usage) as validation of long-term value. Ensure operational metrics to support scaling.
5. Measure Maturity & Impact
In a mature phase, emphasize profitability and sustained impact. Your KPI dashboard should mix financial health with clinical and patient-experience outcomes. For instance, continue tracking retention rates, multi-metric clinical outcomes, and patient satisfaction scores. Also consider strategic measures like market share or the launch of new care modules. At this stage, use healthcare app success metrics that justify ROI to stakeholders: 94% of health startups use multiple outcome metrics (often two engagement, two clinical, one economic) to capture full value.
6. Review, Iterate
Hold quarterly reviews with your leadership team. KPIs should evolve as objectives change. Avoid “copying metrics” from unrelated organizations. Instead, tailor the set as your strategy shifts. Ensure everyone understands each KPI’s role. By phasing your key metrics for digital health apps this way – Pre-Launch, Launch, Scale-Up, Maturity – you can maintain clarity on short-term targets while steadily building long-term healthcare impact.
Conclusion: From Data to Impact
In healthcare app development, the difference between data collection and actionable insight lies in aligning the right KPIs. From user engagement and retention to clinical efficacy, operational efficiency, and financial viability – each metric plays a critical role in validating your product’s performance and guiding future iterations.
By phasing priorities for your healthcare product KPIs – pilot metrics in pre-launch, growth and satisfaction in launch, efficiency and outcomes in scale-up, and ROI and market share in maturity – you create a data roadmap that supports both technical growth and strategic objectives.
Pre-Launch: Set mission-driven KPIs (pilot outcomes, usability tests) and involve stakeholders.
Launch: Measure user growth (installs, DAU/MAU) and early satisfaction; gather user/patient feedback.
Scale-Up: Focus on growth/efficiency (CAC, MRR, partnerships) while tracking real-world outcomes.
Maturity: Focus on ROI and impact (financial returns, sustained clinical improvements, user retention).
Throughout: Align KPIs with the product’s mission and stakeholder needs, adjust metrics as your business evolves.
If your project needs a comprehensive HealthTech audit, we can help you instrument your analytics stack, benchmark against industry standards, and refine your KPI framework – so you focus on what truly drives you forward.
Tell us about your challenges, and we’ll help you deliver measurable health improvements and sustainable business growth.

FAQ
Related articles

.webp)
.webp)
Connect with us
.webp)
We are a tech partner that delivers ingenious digital solutions, engineering and vertical services for industry leaders powered by vetted talents.